
English Housing Survey: Local Authority Housing Stock Condition Modelling
A new statistical series, The English Housing Survey: Local Authority Housing Stock Condition Modelling 2019, has just been released by the Department for Levelling Up, Housing and Communities. In this report we will look at what information it offers and at what we might be able to learn from it.
Firstly, what is the English Housing Survey?
The English Housing Survey is a national survey commissioned by the Department for Levelling Up, Housing and Communities (DLUHC). It is based on a random, annual sample of households. It collects information about our housing circumstances and the condition and energy efficiency of our homes using both household interviews and a physical survey of a sub-sample of properties.
The survey is designed to provide regional and national data on housing quality. It collects information on a continuous basis, and data from the survey is published periodically throughout the year.
More information about the English Housing Survey and links to all past surveys can be found here.
What is the Local Authority Housing Stock Condition Model?
The Local Authority Housing Stock Condition Model is what is known as an experimental official statistical series. The new series is a modelling exercise rather than an actual survey of properties. It is based on data including that provided by the English Housing Survey of 2019.
The significance of the new series is that it provides, for the very first time, a predicted sub-regional estimate of the condition of England’s housing stock.
The DLUHC says that this series has been developed in response to a growing interest in housing quality and that it will support the government’s levelling up agenda. The current government’s ambition is for the number of non-decent rented homes to have fallen by 50% by 2030, with the biggest improvements to be made in the lowest-performing areas.
What the Local Authority Housing Stock Condition Model aims to achieve
The DLUHC say that the purpose of publishing this data is that it will help local authorities find out where housing quality might be poorer/worse than average, how housing quality might vary by tenure and dwelling type, alongside the scale of any problems. It is to be used alongside any other local data and intelligence that might be available.
There are some stipulations as to how the data should not be used however: It only applies to occupied homes, not vacant properties, and cannot be used to estimate local housing stock by tenure. It cannot be used as a replacement for local surveys (where available). It should also not be used to compare the effectiveness of local authority housing enforcement.
More information about how this modelling has been undertaken and the sources, definitions and technicalities behind it can be found in the statistical report itself.
Key takeaways from the findings
It is important to understand that the Decent Homes Standard is very much a benchmark for this new data series, and a key to making sense of its findings.
In brief, to be considered decent under the Decent Homes Standard a home must meet the statutory minimum standard for housing under the Housing Health and Safety Rating System or HHSRS. It is one which provides a reasonable degree of thermal comfort, is in a reasonable state of repair, and has reasonably modern facilities and services. Homes which contain a Category 1 hazard under the HHSRS are considered non-decent.
The new series has been designed to provide modelled estimates of two aspects of England’s housing stock:
The number and proportion of occupied homes that are deemed non-decent according to the Decent Homes Standard in each local authority area, by tenure and dwelling type.
The number and proportion of occupied homes that are deemed unsafe due to having a HHSRS Category 1 hazard in each local authority area, by tenure and dwelling type.
The data suggests that, in 2019, 16.7% of occupied properties overall in England were categorised as non-decent while 9.9% had a HHSRS Category 1 hazard. However, it found that there was a wide variation nationally: In some regions only 9% of occupied dwellings were non-decent but in others over 30% were non-decent. It also found that the number of dwellings with Category 1 hazards ranged from just over 3% to more than 30% depending on the local authority area.
How the proportion of non-decent homes varies by local authority area
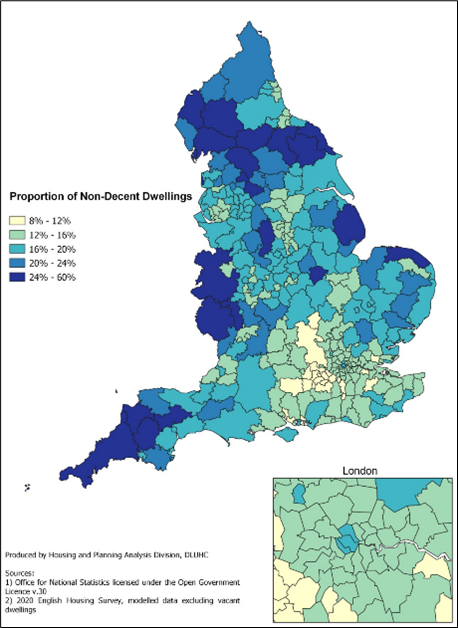
The data illustrates that, when considering all property tenures, local authority areas in the North and South West, together with some districts in the West Midlands, have higher proportions of non-decent occupied dwellings.
How the number of non-decent homes varies by local authority area
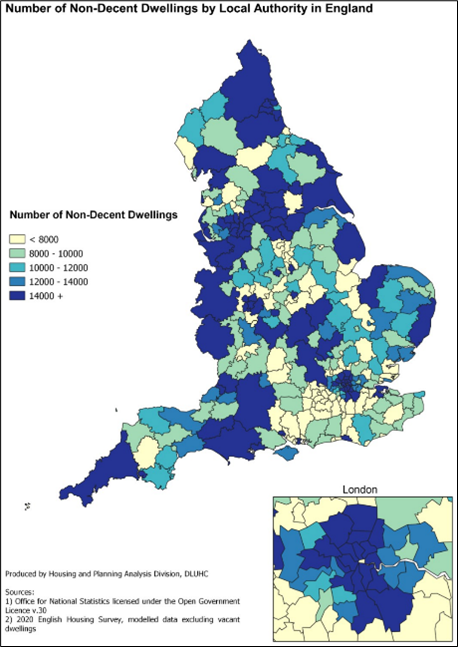
The data illustrates that estimates of the number of non-decent occupied dwellings follows a similar pattern to the proportion of non-decent ones. However, it suggests that urban areas with higher populations and a greater proportion of rented stock are more likely to have non-decent dwellings.
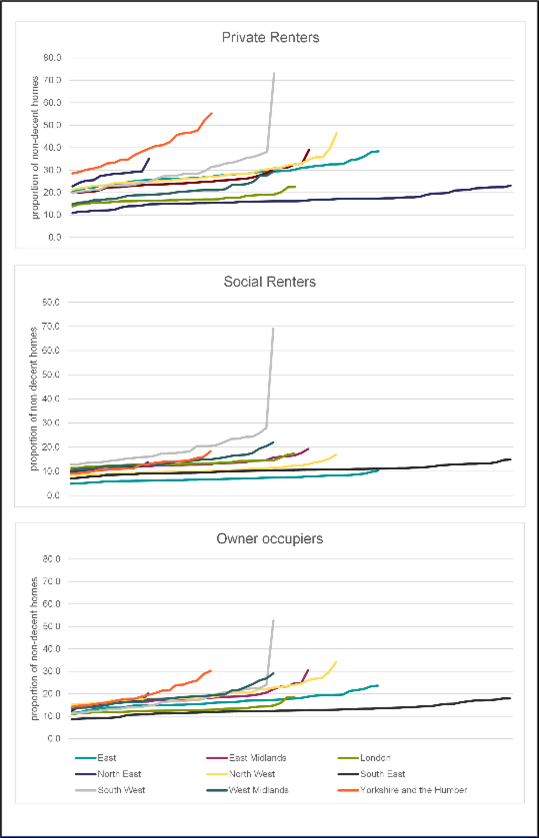
How the proportion of non-decent homes varies by tenure
The series investigates how the proportion of non-decent homes vary by tenure, ie. whether the property is privately owned, a social housing property or a private rental in the PRS.
Here are some of the key findings:
High proportions of non-decent social and private rented accommodation are not necessarily found within the same local authority areas.
There are high proportions of both social and private rented dwellings that are non-decent in the South West region.
The Welsh borders (within England) are more likely to have a high proportion of non-decent social rented homes.
The North, parts of the East, and Yorkshire and the Humber are more likely to have a higher proportion of non-decent private rented homes.

It further finds:
The proportion of non-decent homes does vary by tenure. Rented homes, particularly those in the PRS, are more likely to be non-decent overall.
The proportions of non-decent private rented homes are consistently higher than other tenures across nearly all the local authority areas in England.
The proportions of non-decent owner occupied dwellings are generally lower than for private rented dwellings. But they are higher than social rented dwellings.
The proportions of social rented dwellings have particularly ‘high peaks’ in some local authority areas. These are mainly found in the South West and parts of the West Midlands.
The drivers behind non-decent homes
The series considers what may be the main drivers of non-decent homes. While it does not suggest specifically what drives non-decent homes in each area it draws on the English Housing Survey to offer some suggestions. It says that there is a strong relationship between both energy efficiency of a property, the age of a property and its quality.

The series suggests that a full 96% of properties which have an Energy Performance Certificate (EPC) grade of F or G are non-decent. It suggests that 32% of properties built before 1919 are non-decent.
How Category 1 hazards vary by housing type
The series provides some statistics of how hazards vary by housing type. It suggests that the overall pattern of dwellings with a hazard is similar to the pattern of non-decent dwellings.
Overall the data suggests that suggests Category 1 hazards are more likely to be found in houses than in flats. It further suggests that while only 8% of flats have a Category 1 hazard, the figure is 9% for bungalows and 10% for both detached and semi-detached houses. It says terraced houses are relatively the most hazardous with 12% of such properties having a Category 1 hazard.
Some final thoughts
It is important to recognise that the English Housing Survey: Local Authority Housing Stock Condition Modelling 2019 is a new endeavour. The DLUHC says the intention is that it will become an annual series. So it will likely mature over time.
Some might say that its findings are to some extent stating the obvious – that poorer, urban areas with much ex-industrial property that is now within the PRS were always likely to have less good quality housing. But that would be missing the point. This is the first time that this data has been modelled in this way and presented as an official statistic.
As the series develops, and assuming it is widely used, it could have some implications for the housing market. Potentially, it could be used to help target funding, aid enforcement, develop policy or inform new legislation. It may for example have some bearing on the pending proposals to apply the Decent Homes Standard to the PRS. The direction of future government housing policy will also be relevant.
The new statistical series may also be of some use to property investors and landlords, in helping them to understand future opportunities and challenges in the PRS.
Illustration credits: DLUHC. Contains public sector information licensed under the Open Government Licence v3.0.